Process level monitoring and alerting in Prometheus
Introduction
Most of the Linux systems these days use systemd for service management, is responsible for starting rest of the system and is assigned the PID 1. We can easily create a service out of command by writing a systemd unit file for it. This is typically the practice for making sure a process keeps running as a system process and avails a valid PID. This is multiple benefits as well, you can read/manipulate the logs by using journalctl, start/stop/restart a service, send required signals to it, etc.
Need
As we looked at the benefits above, it becomes quite necessary to monitor systemd services hence. You should be aware of the current state of the services. In my case and many others, I run the web server as a systemd service and hence it becomes utterly important that I know if it as gone down or not, when it has gone down, for how long, etc.
So apart from monitoring we will also look at how we can set up alerts so that we can receive an email whenever a particular process/service goes down.
Steps
First you need to set up
SMTPconfiguration in Grafana in order to be able to send mails. You can read about it in this article.Now you need to modify the
node_exporterto be able to export thesystemdmetrics. For this you just need to pass a flag namedsystemdto thenode_exportercommand. Here I’ll show you how I did it.On the target machine open the
node_exporterservice’s unit file. You can find by looking at the output ofsystemctl status node_exporter.service.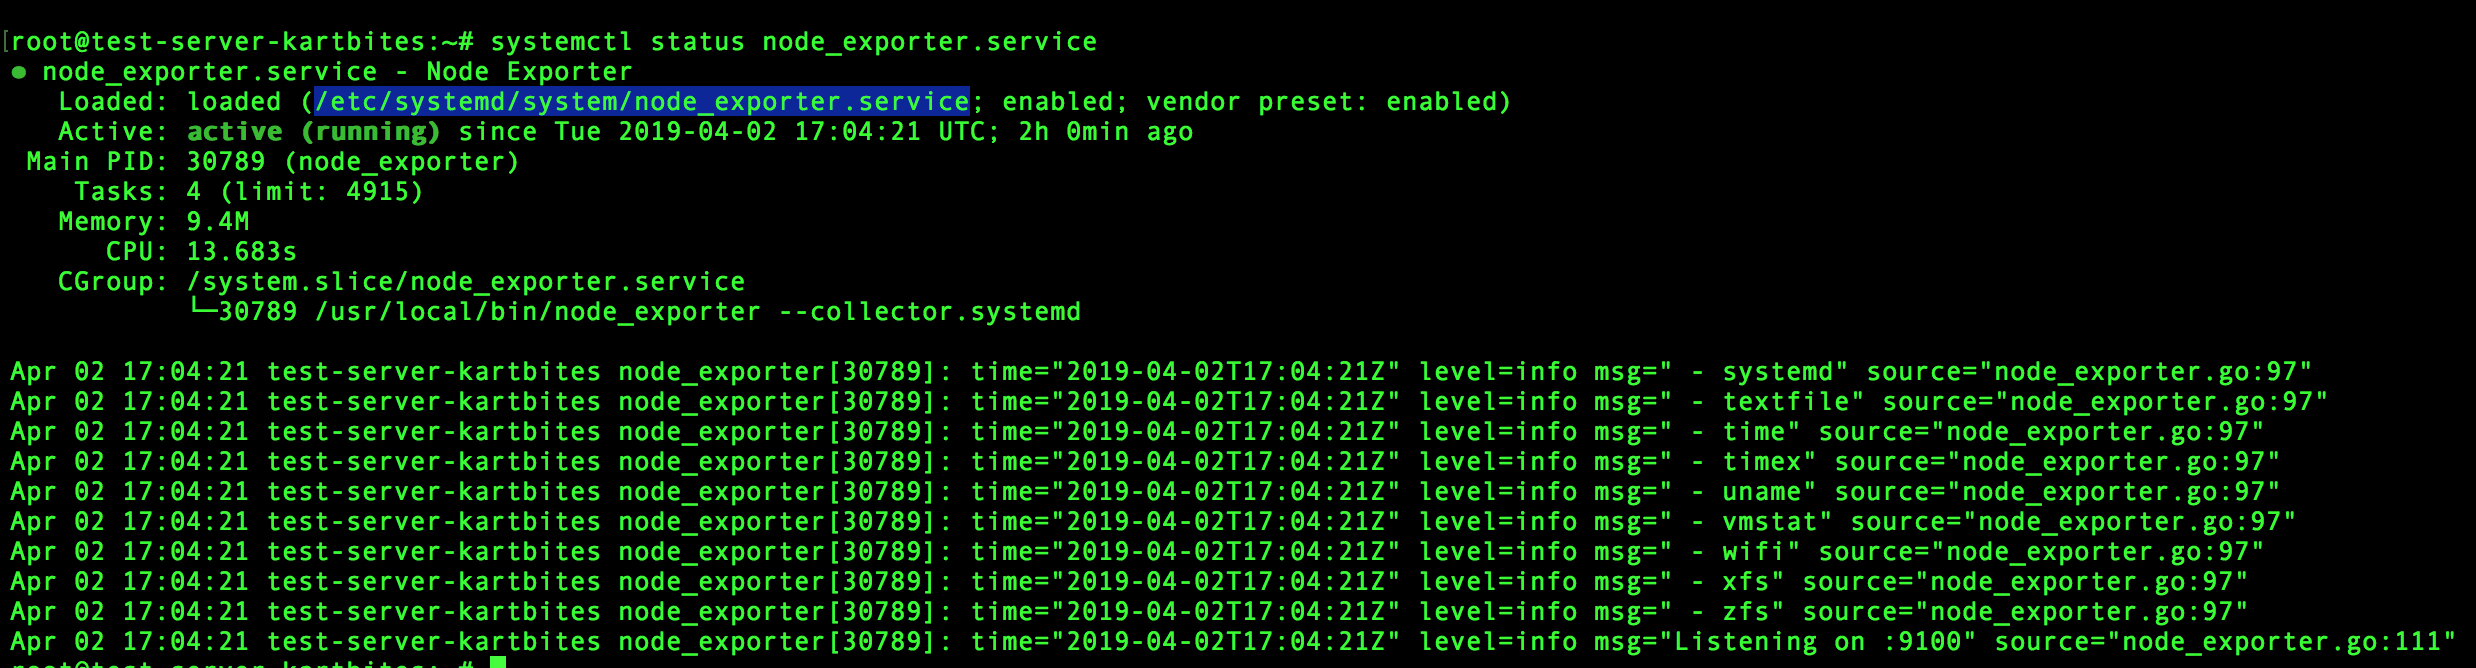
Modify the
ExecStartand append--collector.systemd(I’m sure there are better ways than hardcoding like this, but for now let’s do it this way)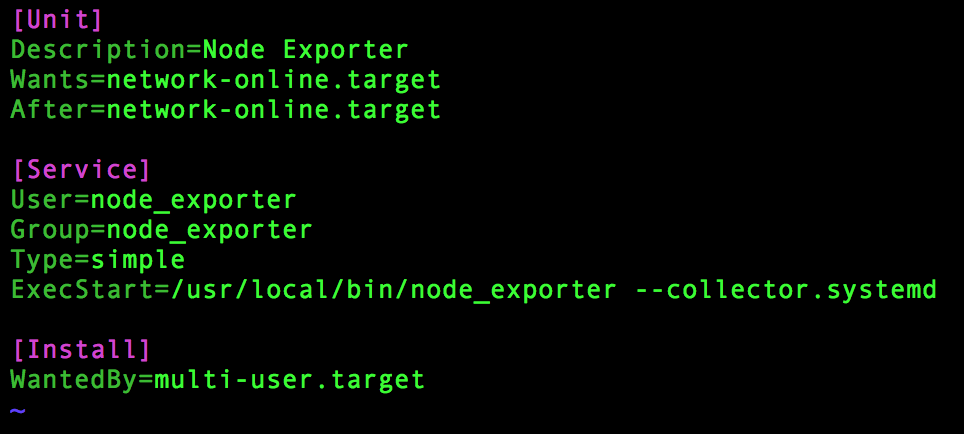
Reload the changes
sudo systemctl daemon-reload.Restart the service
sudo systemctl restart node_exporter.serviceto apply the latest changes to the unit file.Optionally we can append
$ARGSenvironment variable to theExecStartand put its value in the~/.profile.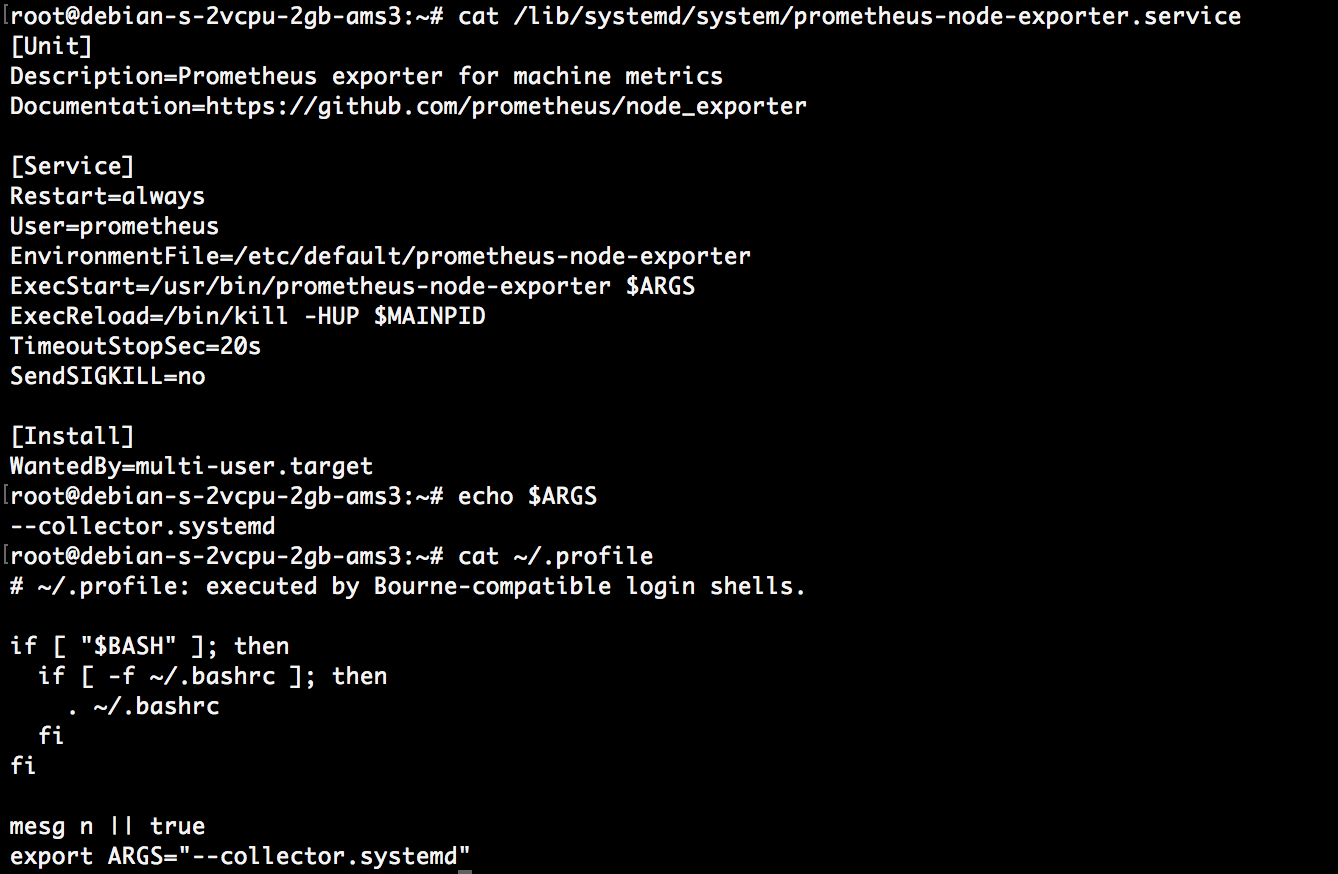
Now you need to make Prometheus able to scrape the metrics sent by the node_exporter and for doing that you need to modify the configuration of Prometheus (typically the prometheus.yml file). Add the following:
- job_name: 'node-exporter'
  scrape_interval: 5s
  static_configs:
    - targets: ['<ip-of-server-running-node-exporter>:9100']
Create a new Dashboard in Grafana for monitoring the required service. Here, for example, let’s monitor a service called
go-analyzer.service.- Select the
Add Queryoption. - Write the query
node_systemd_unit_state{name="go-analyzer.service"} - It will look like-
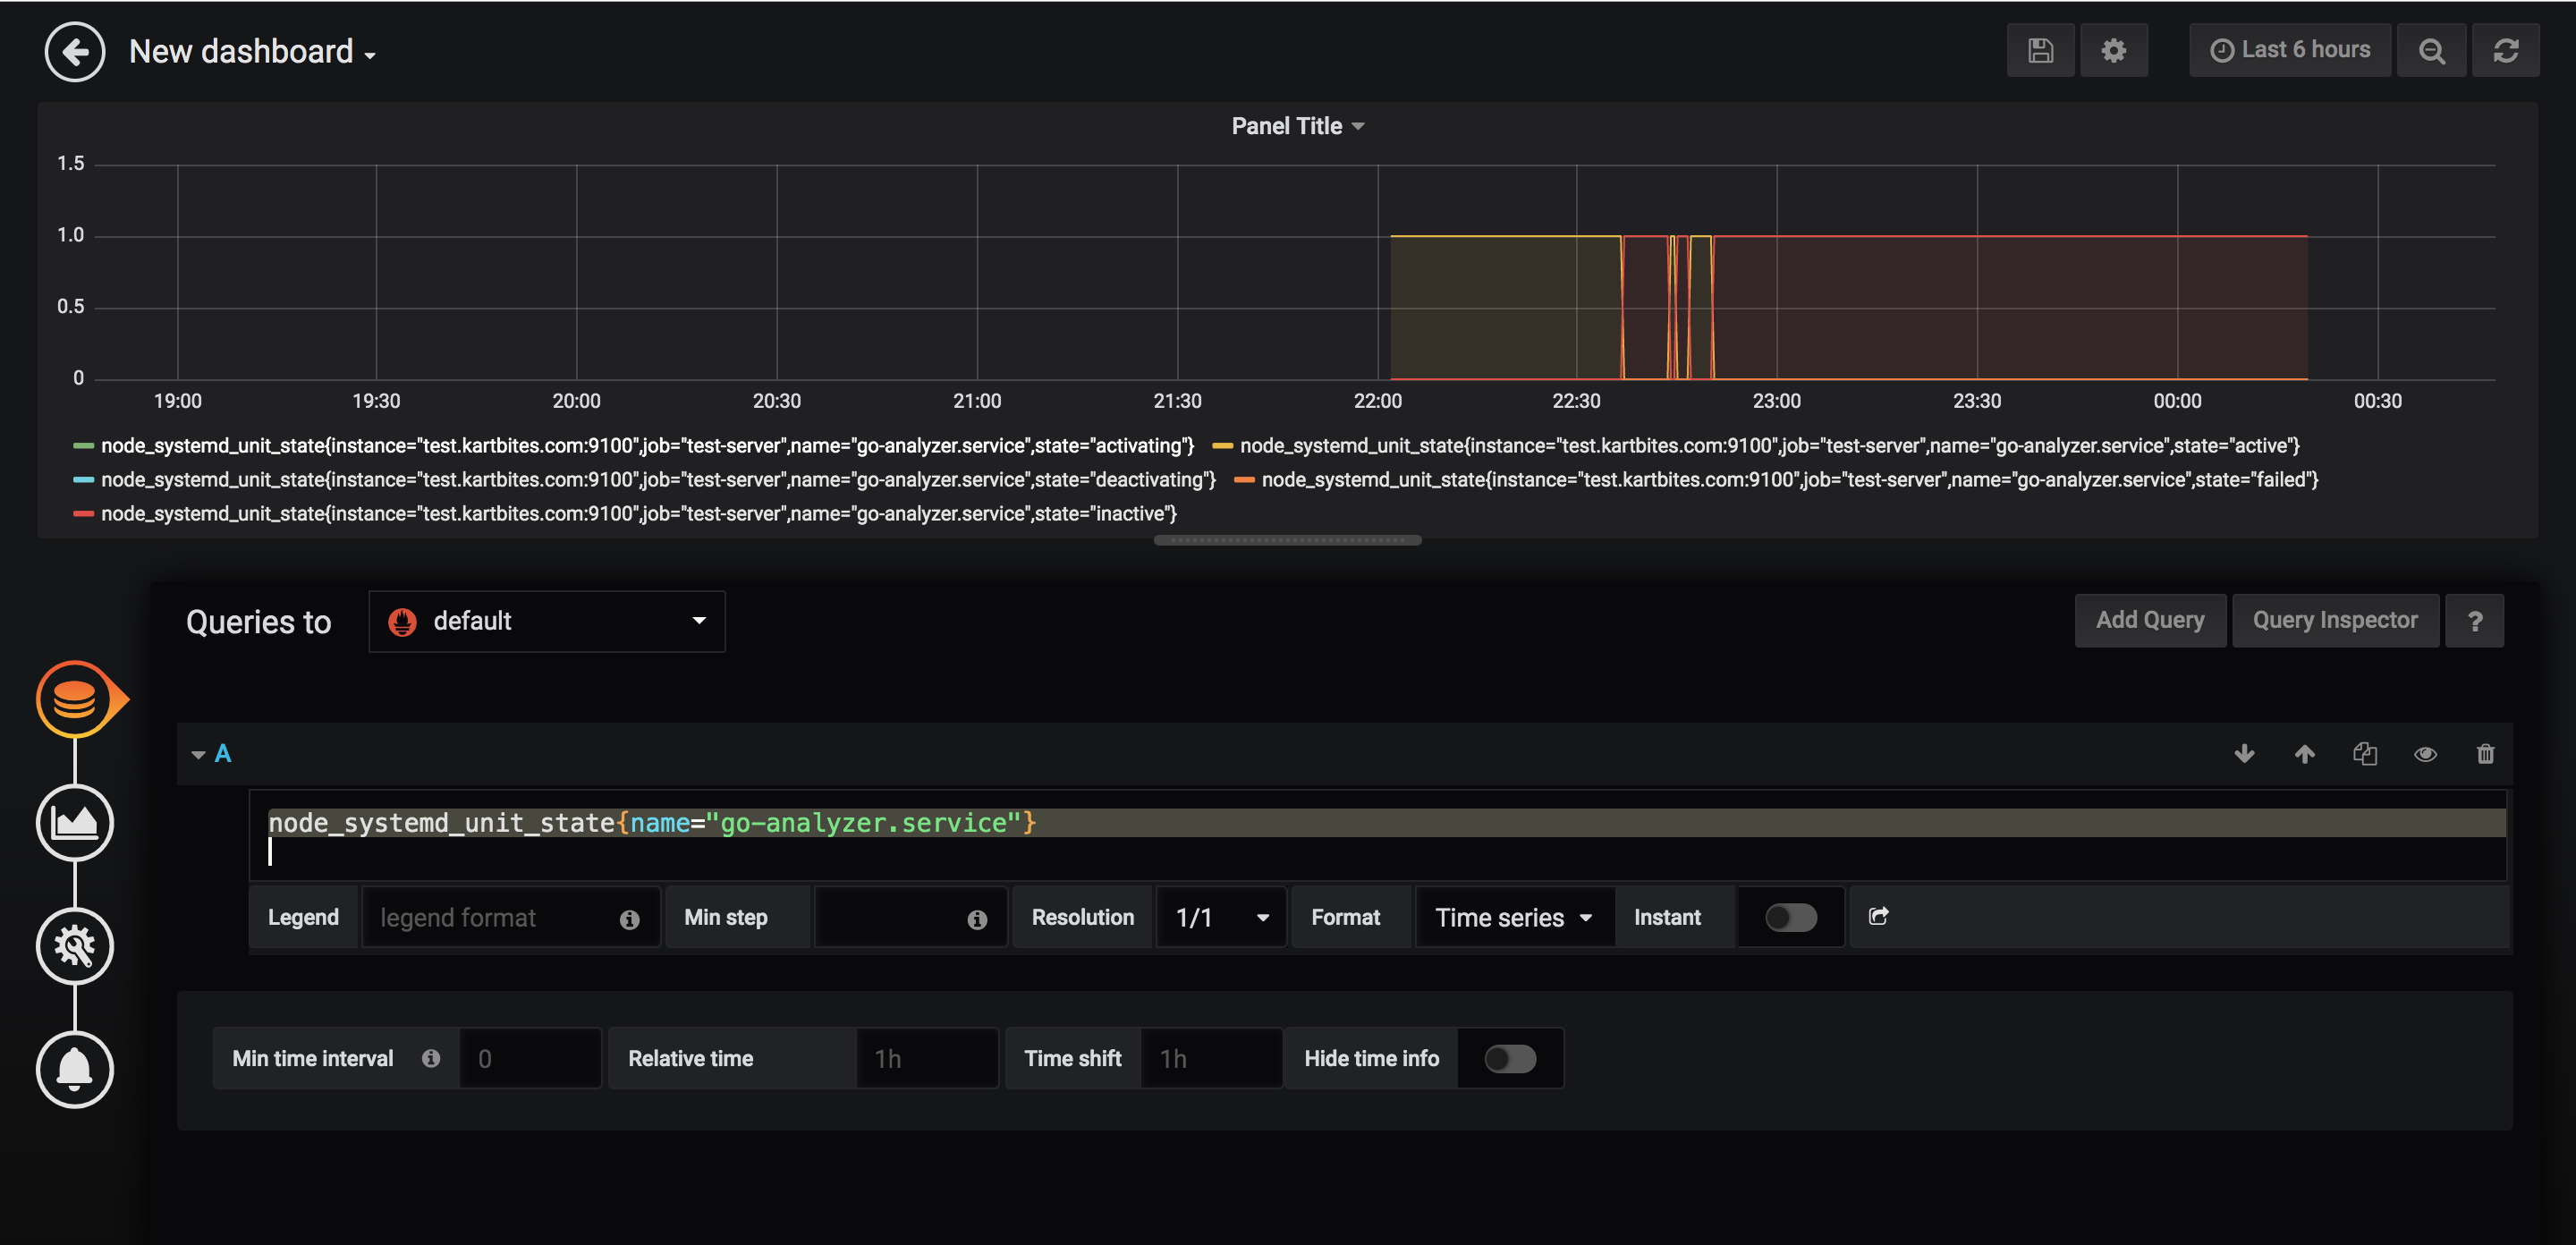
Voila! Now you can monitor the state of
go-analyzerprocess- Select the
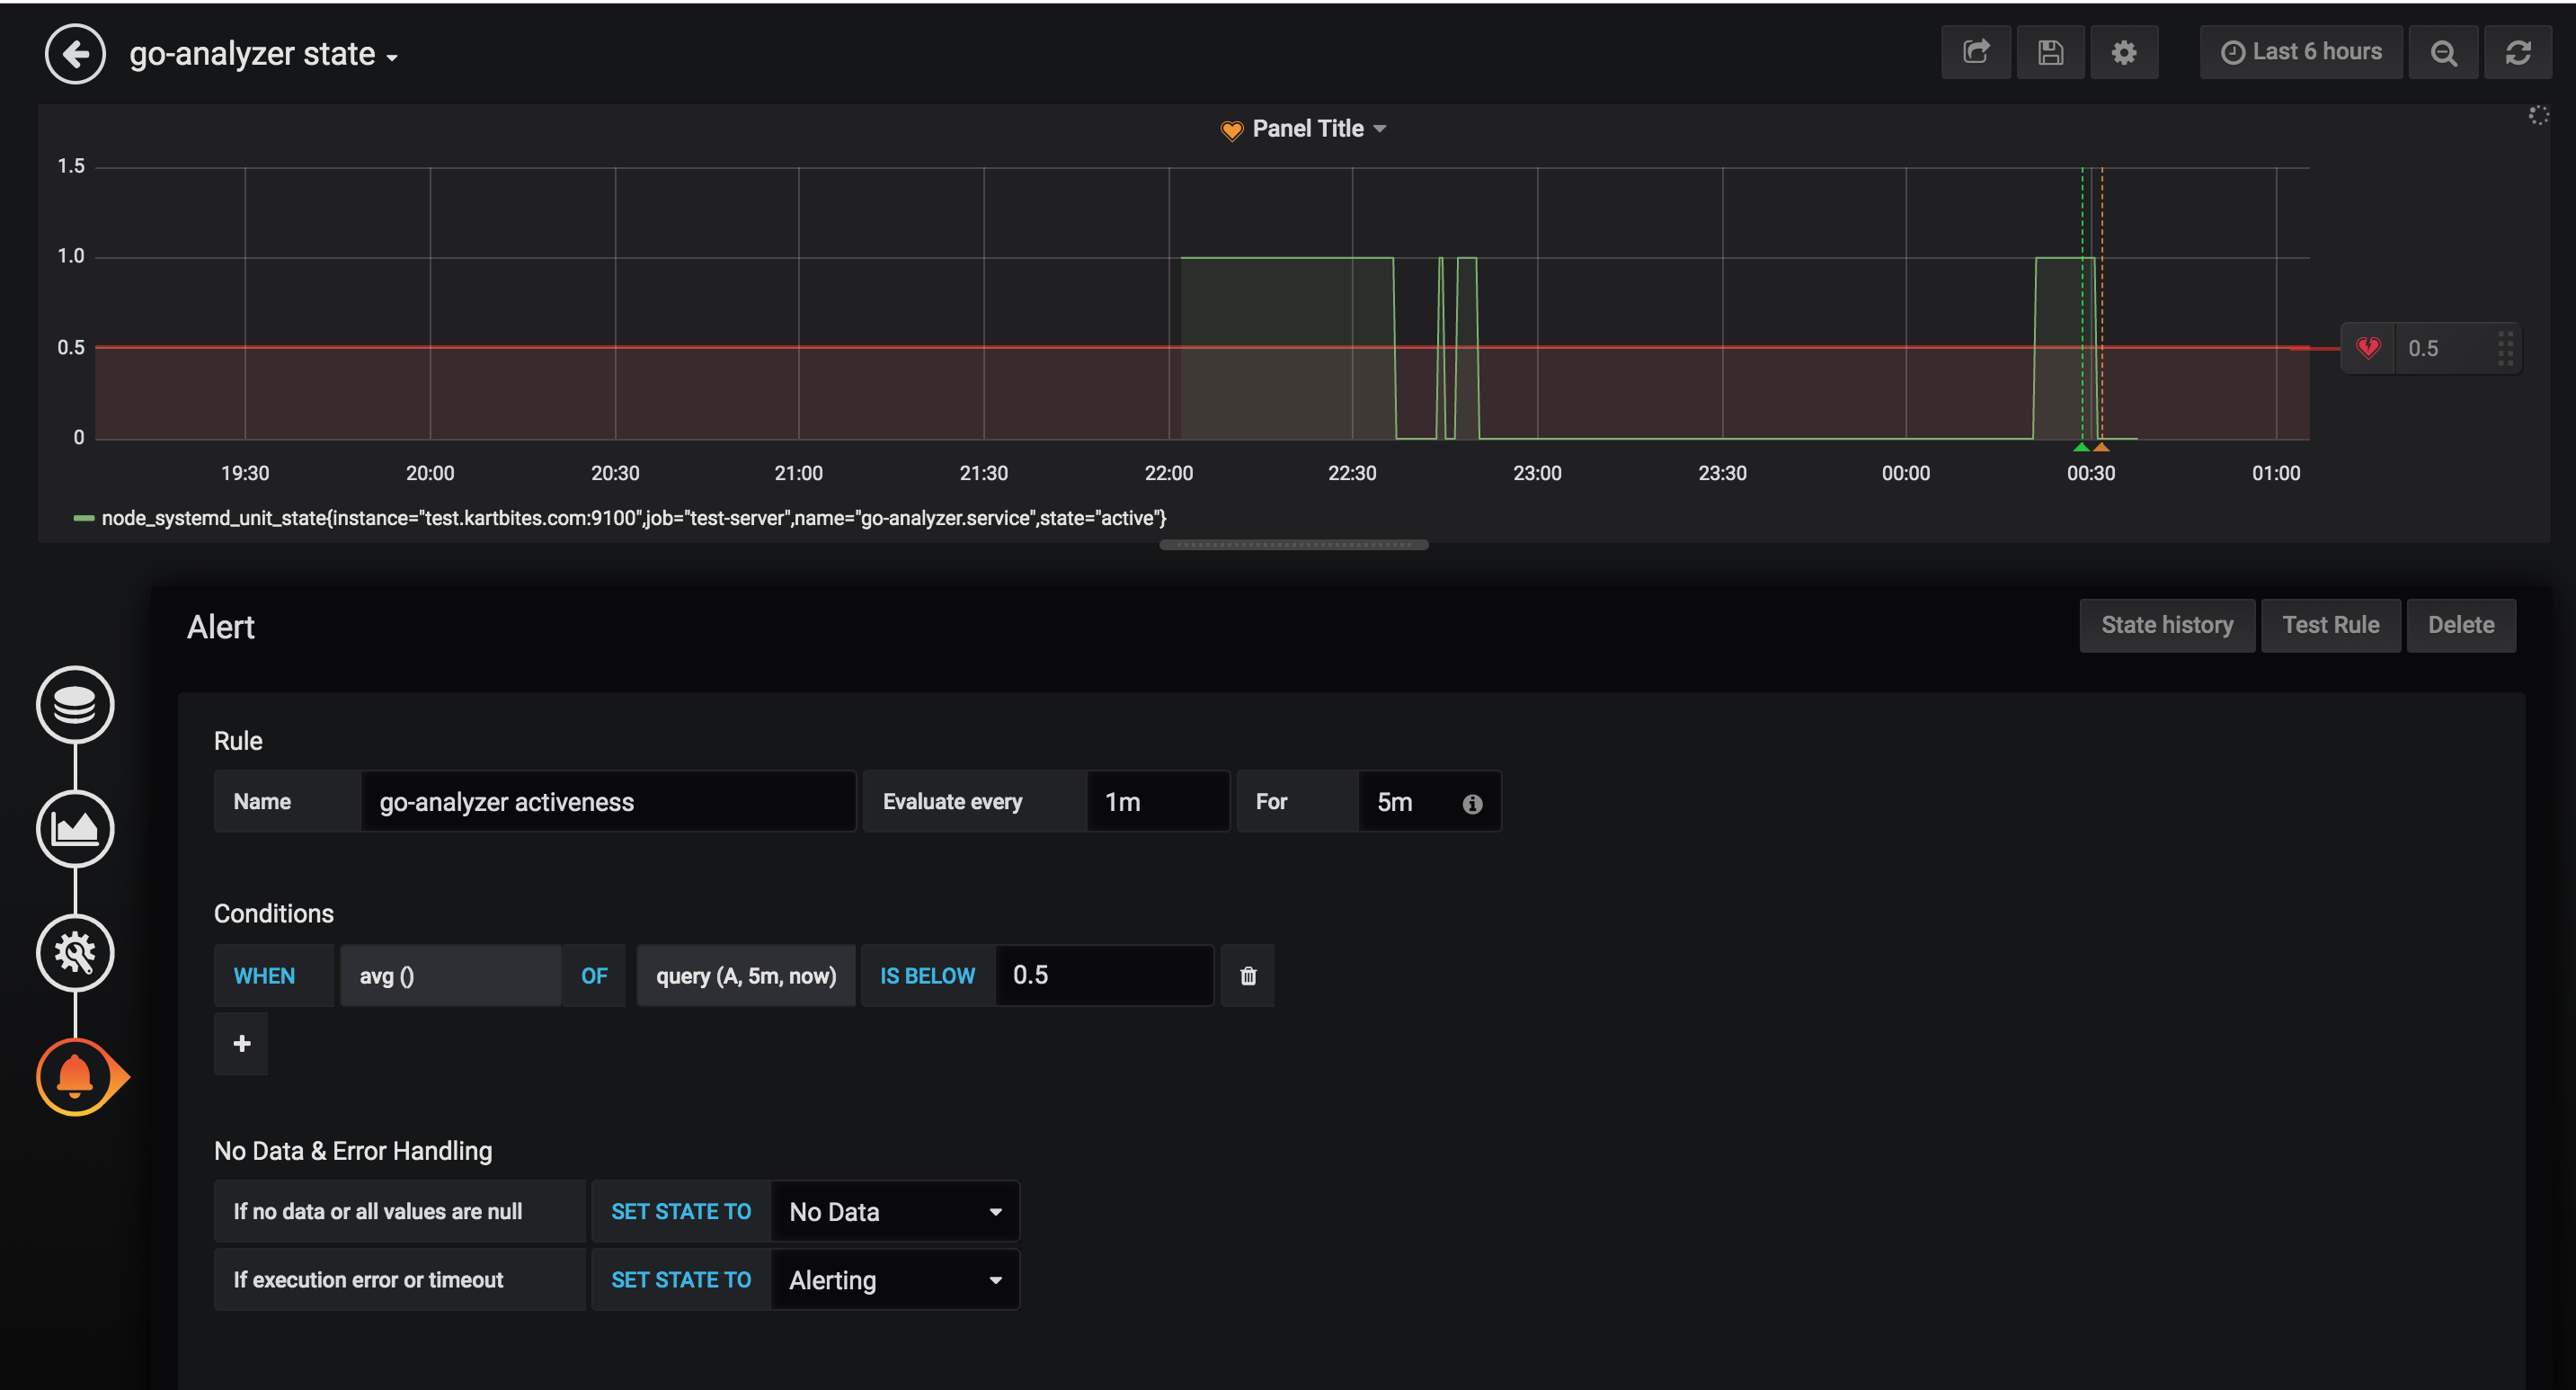
Now we’ll try to setup alert on this process so that we can get notified if this service goes down.
- Modify the above mentioned query to
node_systemd_unit_state{name="go-analyzer.service",state="active"} - Go to
Alertsection andCreate Alert - Set the condition like -
- You can send an email alert as well, to a channel (like Server Team here) or an individual. But for this, you need to set-up Grafana with
SMTPcredentials and to do that follow Alert Manager in Prometheus.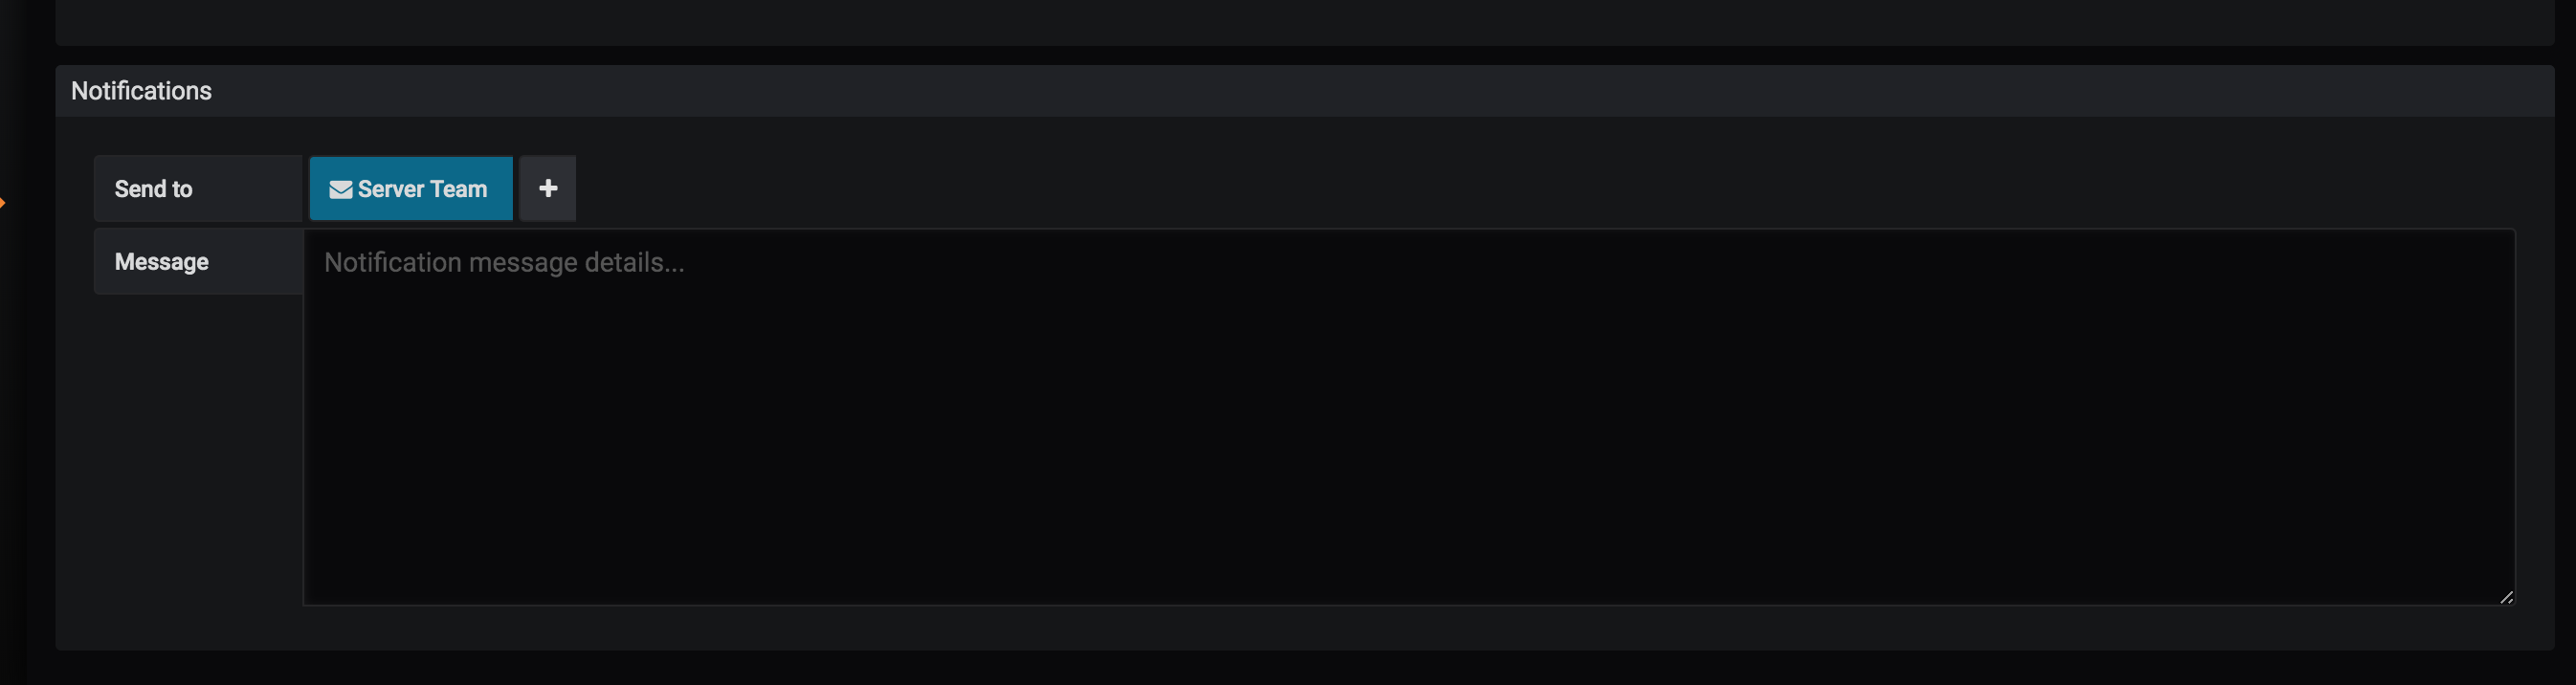
- Now save the dashboard and you are all good to go!
- Modify the above mentioned query to
Conclusion
To test the Alert, try to stop the service by doing sudo systemctl stop go-analyzer.service. You should get an alert email soon. 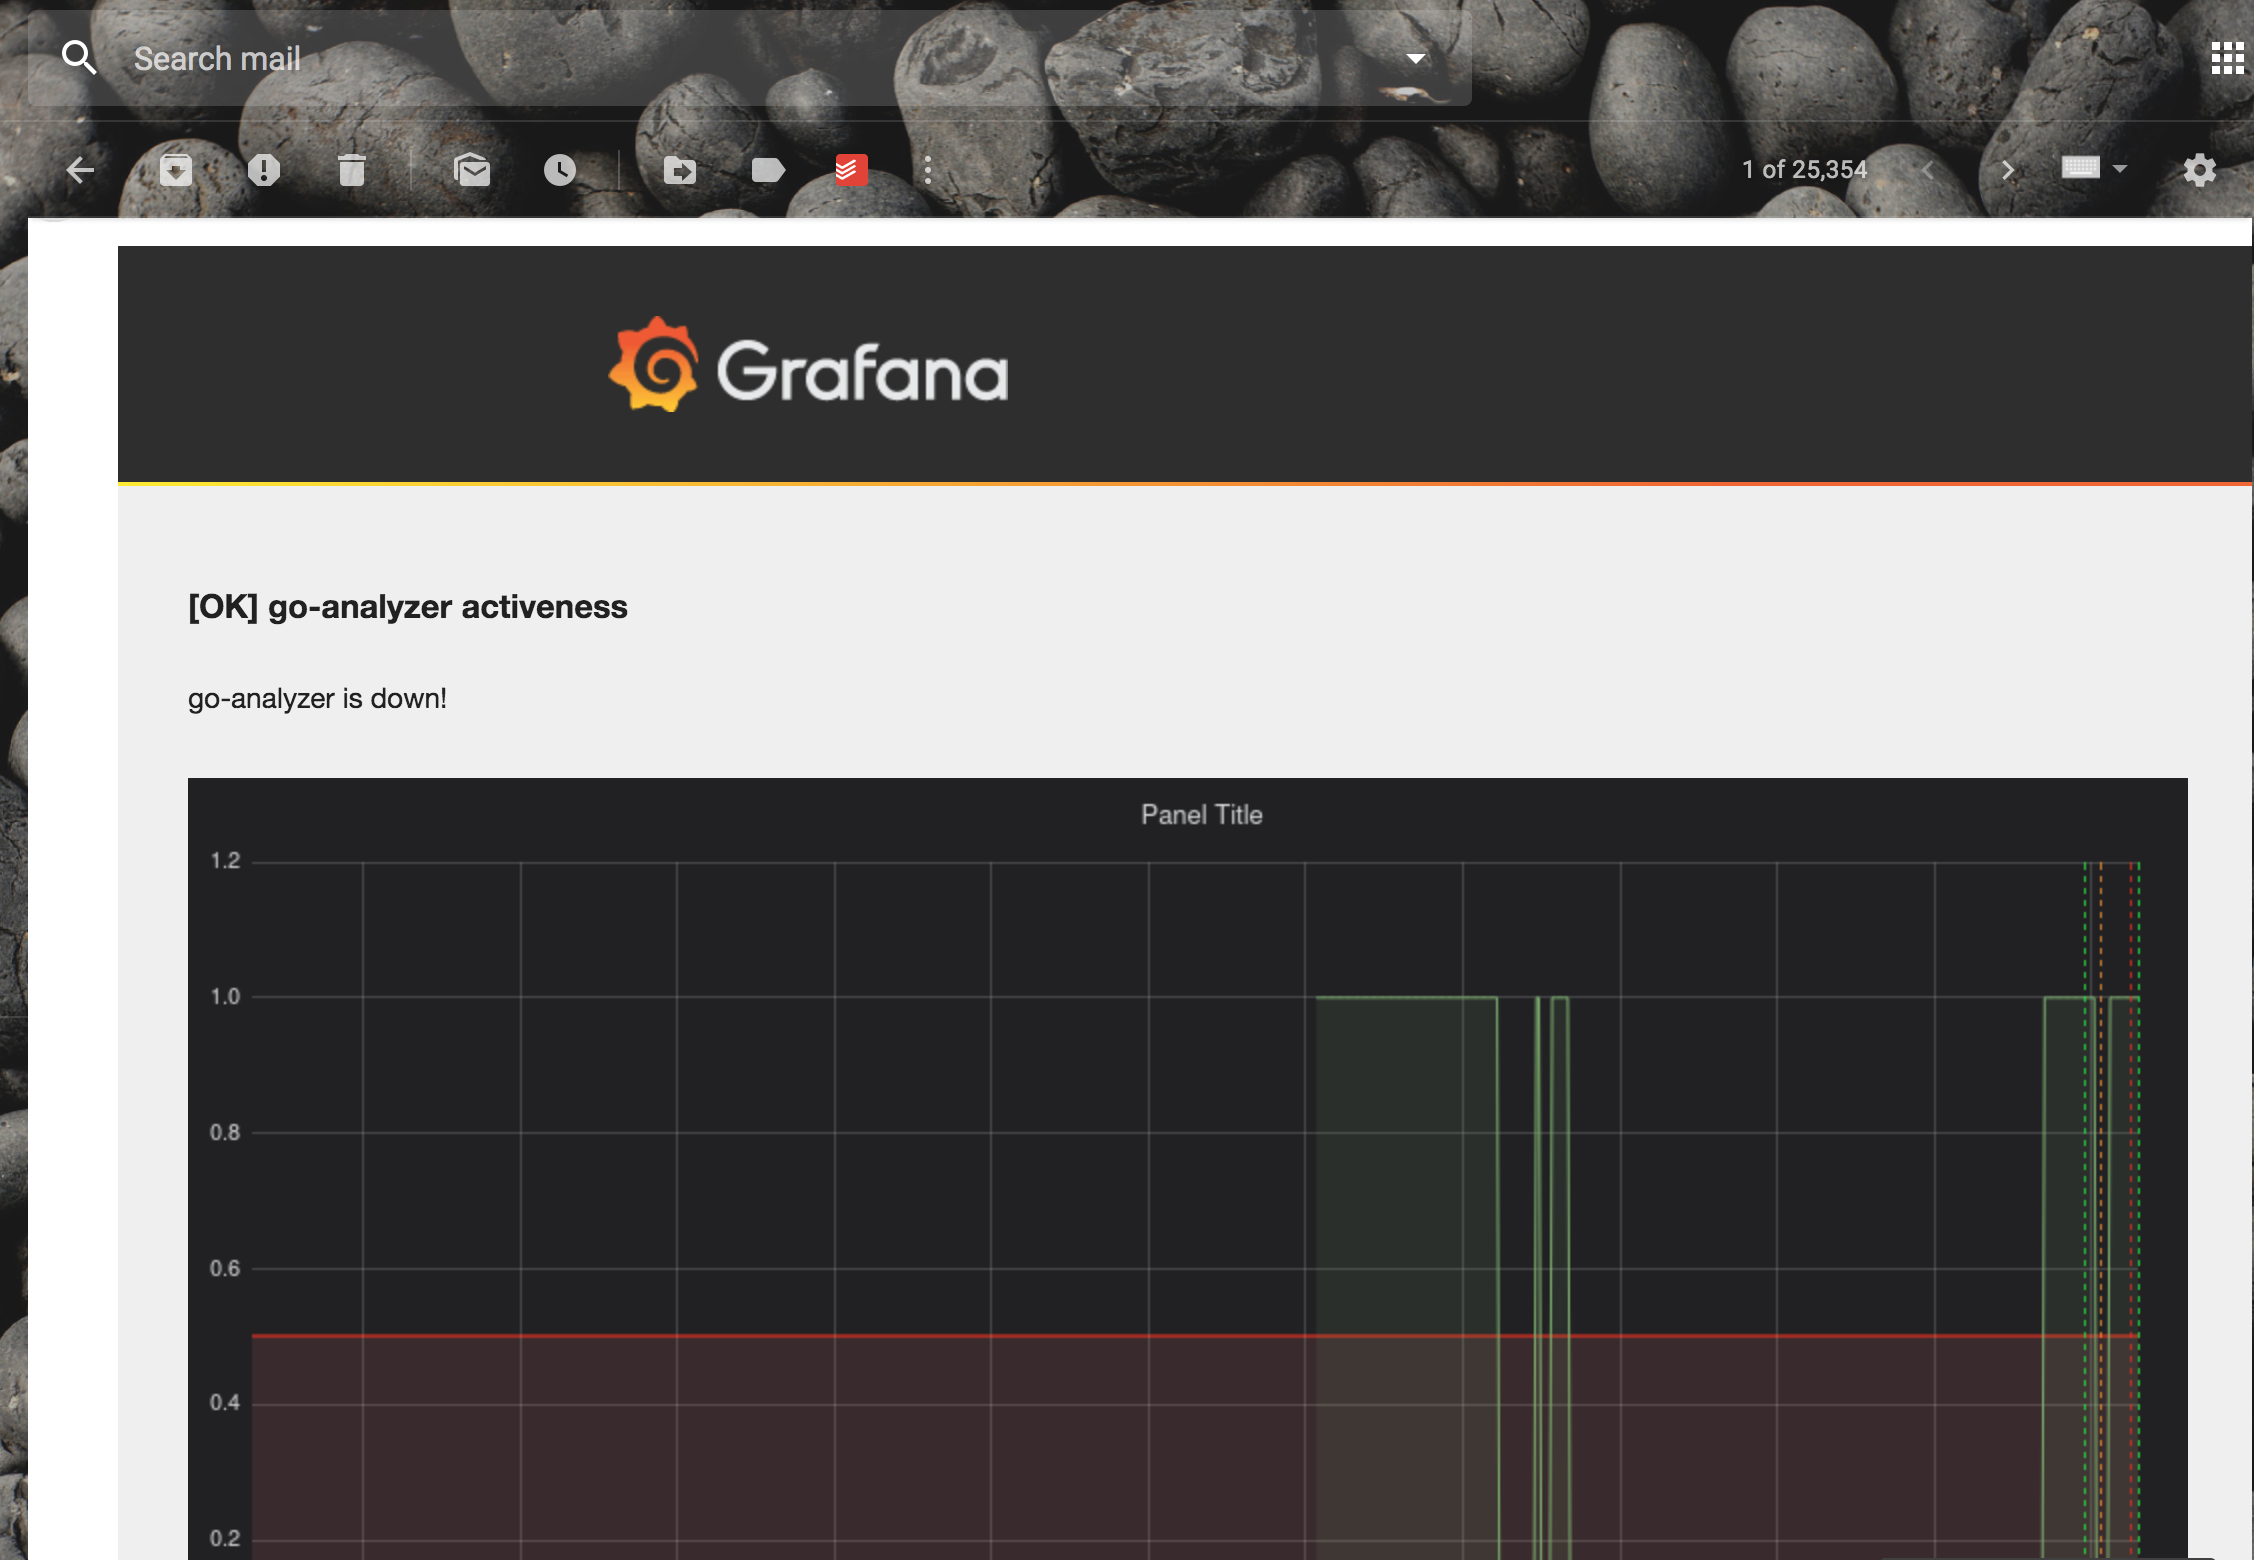
Now you rest assured that whenever a crucial monitored service (maybe database, server, MQ service,etc) goes down you will be informed quickly and hence take required action faster!